
Streamlining Additive Manufacturing with Lean Principles
Additive manufacturers can improve efficiency, reduce waste, and boost overall performance by incorporating lean principles.
Automotive
Versatech Increased OEE 30%
Consumer Package Goods
Oral Biotech Eliminated Scrap
Food/Beverage
Louisiana Fish Fry Increases OEE 12%
Metal Stamping
H&T Waterbury Reduced Downtime 71%
Blow Molding
Lyons Blow Molding Automated Reporting & Labeling
Dashboards have become indispensable tools for manufacturers looking to boost their efficiency and performance. Manufacturing dashboards provide a comprehensive overview of various metrics and key performance indicators (KPIs) that are crucial for monitoring and managing manufacturing processes. They collect and contextualize data from different sources. This visual dashboard enables decision-makers to gain valuable insights into production, supply chain, quality control, and other critical areas of the business.
Reduce downtime, get realtime visibility, replace manual reporting, unlock capacity and increase OEE with the right dashboard.
Manufacturing dashboards provide a centralized platform for monitoring and managing key metrics. With real-time data visualization, customizable widgets, interactive charts, and drill-down capabilities, these dashboards empower users to analyze data at both macro and micro levels. By integrating data from various sources, manufacturing dashboards help improve productivity and drive business success.
Production monitoring software helps manufacturers of all industries increase efficiencies while growing profits. One of the key advantages is their ability to drill-down into the data you need. Users can start with a high-level overview of their operations and then dive deeper into specific areas of interest. For example, if there is a sudden drop in production output, decision-makers can drill down into the data to identify the root cause. They can quickly identify if there was a machine breakdown or a supply chain disruption.
This level of detail enables proactive problem-solving and helps in minimizing downtime and maximizing efficiency.
Schedule a demo with Mingo Smart Factory today! Built by people who know manufacturing, Mingo provides the 21st century “Smart Factory” experience that manufacturers need to grow in a modern environment. See how it can help you reduce downtime, improve efficiency and drive revenue.
Manufacturing dashboards offer a real-time data visualization, presenting information in a clear and concise manner. With customizable widgets and interactive charts, users can easily track and analyze key metrics such as production output, machine efficiency, and inventory levels. These visual representations make it easier for decision-makers to identify trends, patterns, and anomalies.
By providing real-time visibility into production metrics, personnel can quickly identify bottlenecks, inefficiencies, and areas that require improvement. Dashboards enable operators to take prompt corrective actions, optimize resource allocation, and reduce downtime.
One example of how dashboards enhance efficiency is through the use of predictive analytics. By analyzing historical data and trends, dashboards can provide valuable insights into future production patterns. This allows businesses to proactively adjust their operations, such as scheduling maintenance during periods of lower demand or increasing production during peak times. By leveraging these predictive capabilities, companies can optimize their resources and minimize waste.
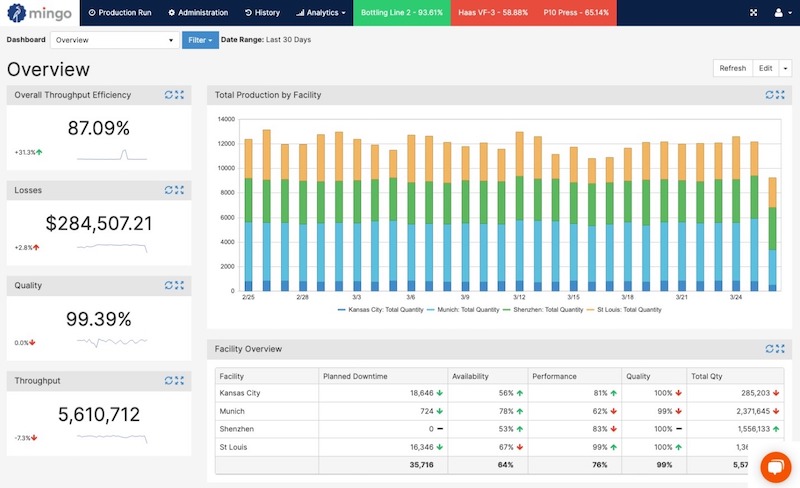
Manufacturing dashboards can collate data from various systems and departments within the organization. This integration allows decision-makers to have a holistic view of the entire manufacturing process, from raw material procurement to finished product delivery. They can identify bottlenecks, optimize workflows, and streamline operations to improve overall productivity and profitability.
Dashboards facilitate communication and collaboration among different departments. Teams can easily share information, identify dependencies, and coordinate their efforts. This streamlines decision-making processes, reduces the likelihood of miscommunication, and ensures that everyone is aligned towards common goals.
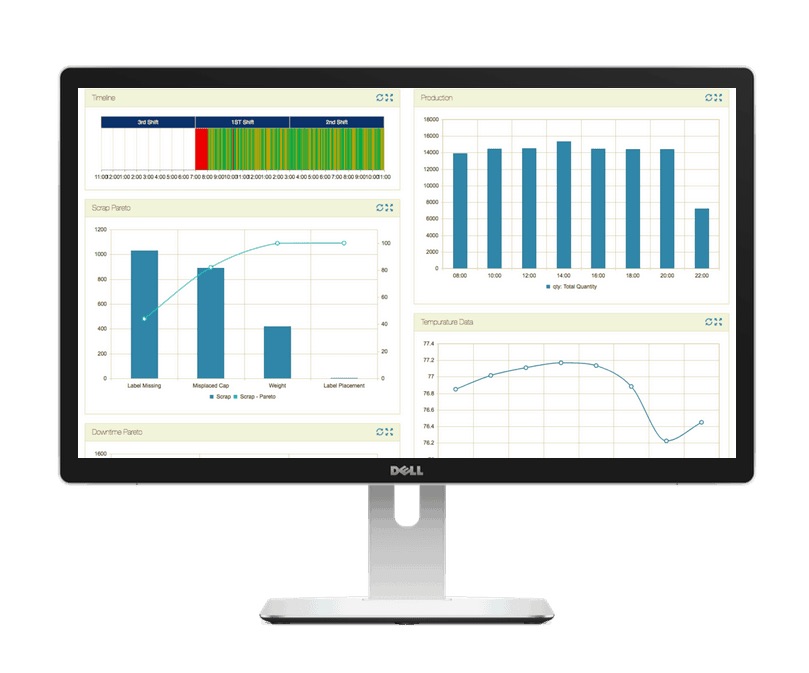
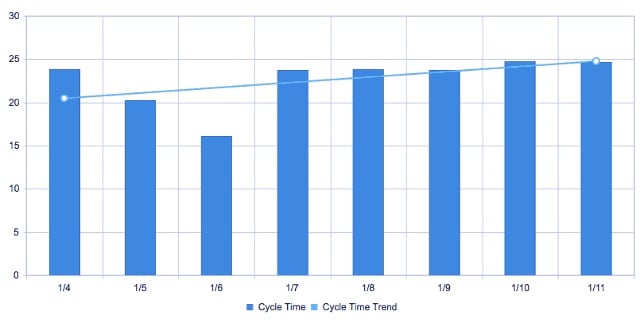
Dashboards can enable businesses to identify areas where processes can be simplified and streamlined. Companies can identify steps that are taking longer than expected and implement measures to reduce those bottlenecks. For example, by analyzing cycle times. This leads to increased productivity and reduced costs.
Manufacturing dashboards also play a crucial role in fostering collaboration and communication within the organization. With real-time data available to all stakeholders, everyone can work together towards common goals. This shared visibility promotes transparency, accountability, and alignment, leading to better coordination and ultimately, improved business outcomes.
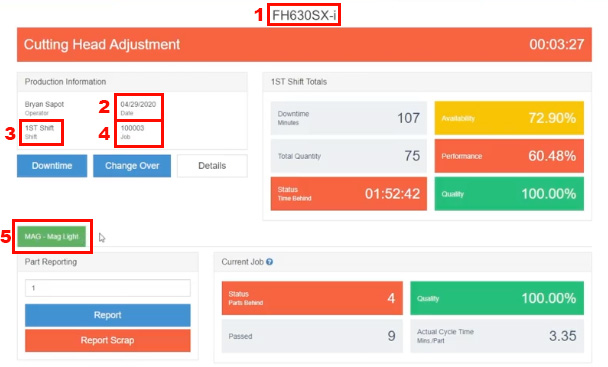
The production level data on the right side of the screen may change based on the industry and part, but the main goal is to color code the performance results so the operator can see at a glance if they are on track to hit their goals for the day.
The event log along the bottom of the screen tracks specific data points like downtime, scrap and quality that are contributing to the aggregate data points.
Operators can use the event log to report scrap, adjust quantities when performing quality checks or edit log events to correct things like downtime reasons.
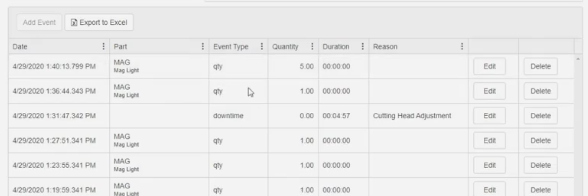
Cycle times are only one component of an efficient factory floor. Data-driven decisions start with automatic data collection, real-time visibility and manufacturing analytics.
This 20 question assessment will take about five minutes and show you:
The Mingo Smart Factory dashboard is 100% configurable to show you the data that matters most with context. The heart of the manufacturing dashboard is the filter system. If you want to get an overview of machine performance from one specific plant, you can create that filter in the administration dashboard. It will then appear as one of the Dashboard Dropdown Options.
With Mingo Smart Factory, you can reduce scrap, identify areas for improvement, increase visibility into what’s happening in the plant to meet demand. The ability to easily schedule work helps discrete manufacturers know whether they are ahead, behind, or on schedule to meet customer orders.
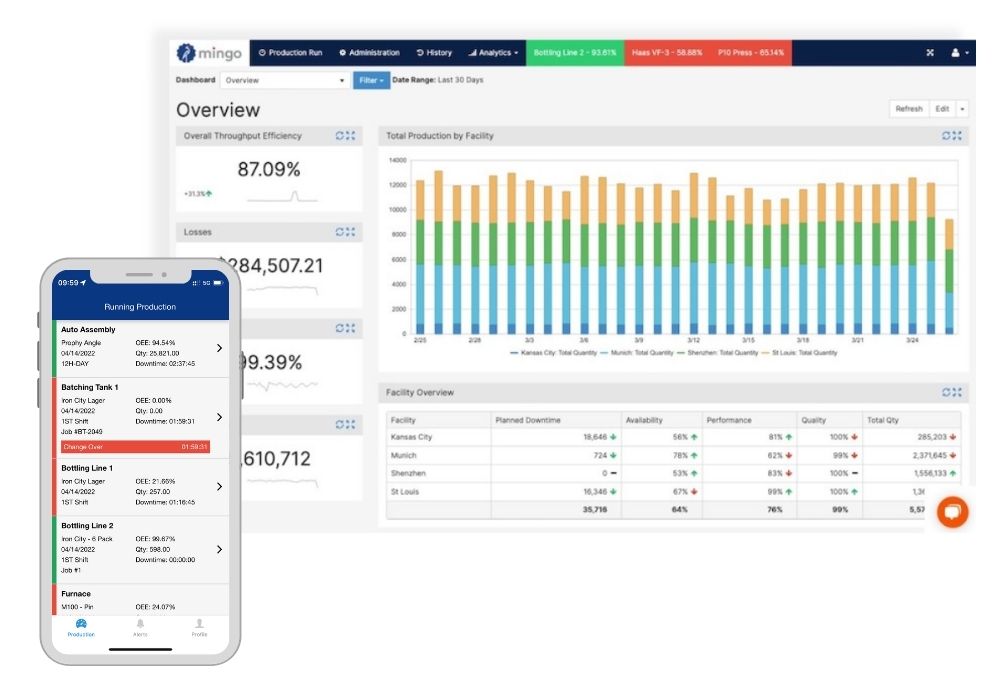
Manufacturing Insights are summary dashboards subscriptions that are delivered via email on a specific schedule.
As an example, manufacturers can set up the system to produce an email (with corresponding dashboards) before daily production meetings. These will have up-to-date production stats from the previous day. The entire team can have these reports in-hand, with accurate statistics that will put everyone on the same page. This also gives those that are not “regular” users of the platform, valuable insights as to what is going on. Everyone is looking at the exact same thing.
The other way were using the data is through alerts. These can alert users of errors and/or warnings of a machine. Alerts can also be created based on the state of the machine, either in real-time or intentionally delayed.
As an example, if a machine is down for a minute, an immediate alert would be sent out to the shop floor operator. If that same machine is down for thirty minutes, a delayed alert would be sent to the plant supervisor and maintenance staff. If a machine is down for longer than that, an entire organization can be alerted.
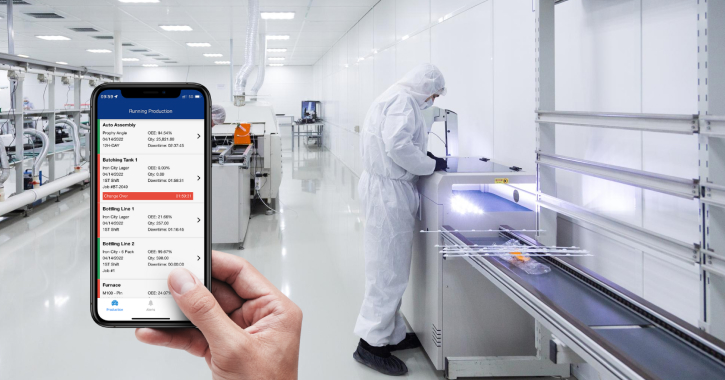
Manufacturing dashboards can also serve as performance indicators, helping businesses evaluate their performance against goals and targets. By tracking key metrics such as production output, quality control measures, and customer satisfaction, dashboards provide real-time insights into performance levels.
Furthermore, manufacturing dashboards offer a comprehensive view of the entire production process. With detailed data on each step of the manufacturing cycle, businesses can identify bottlenecks, inefficiencies, and areas for improvement. For example, by analyzing the data on production efficiency, companies can pinpoint specific machines or processes that are causing delays or decreasing overall productivity.
Moreover, manufacturing dashboards enable businesses to monitor and optimize production in real-time. By tracking cycle times and machine utilization, companies can identify patterns and trends that impact production efficiency. This allows them to make informed decisions on resource allocation, scheduling, and workflow optimization.
Additionally, manufacturing dashboards provide valuable insights into quality control measures. Manufacturers can quickly identify areas of concern and take immediate corrective actions. This not only improves product quality but also enhances customer satisfaction and loyalty.
Another advantage of manufacturing dashboards is their ability to facilitate data-driven decision-making. With access to real-time data and visualizations, managers and executives can make informed decisions about resource allocation, capacity planning, and process improvement initiatives. This ensures that decisions are based on accurate and up-to-date information, leading to more effective and efficient operations.
By leveraging these insights, companies can optimize their operations, reduce waste, and improve overall performance. With the ability to make data-driven decisions, manufacturing dashboards are essential for businesses looking to stay competitive in today’s fast-paced manufacturing landscape.
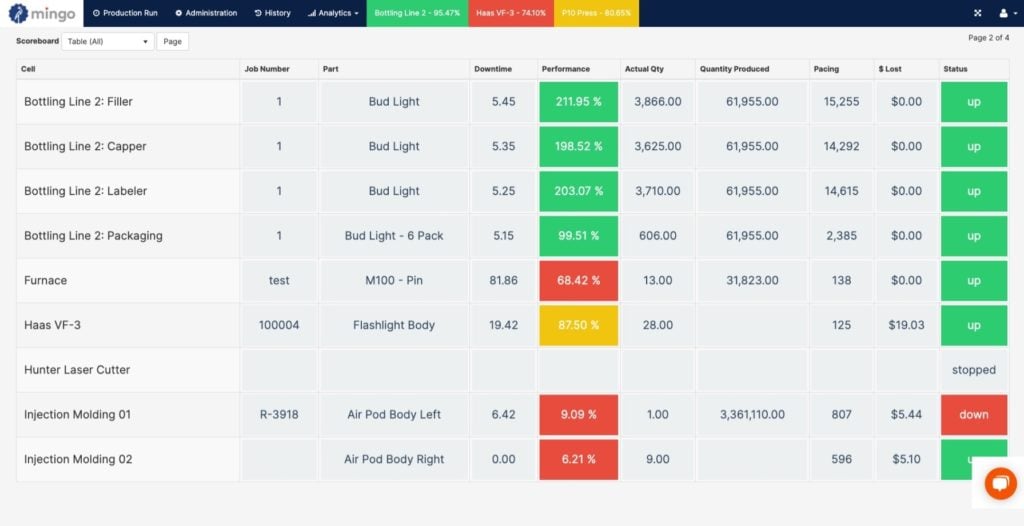
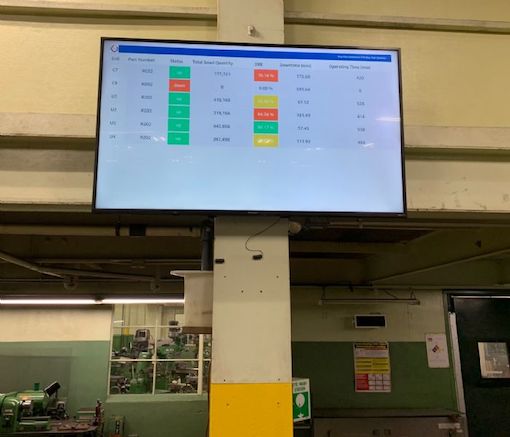
Multiple machine scoreboards are Mingo Smart Factory’s most popular feature. Customers will project this scoreboard on television screens across the factory floor or break rooms to help operations know how they are doing that shift at a glance.
Implementing manufacturing dashboards can be a complex process, but with careful planning and execution, it can be highly rewarding. The first step is to define the objectives and Key Performance Indicators (KPIs) that the dashboard will track. This involves understanding the specific needs of the business and aligning the dashboard with its strategic goals.
Defining the objectives requires a deep dive into the manufacturing processes and identifying the key areas that need to be monitored and improved. For example, a company may want to track production efficiency, quality control metrics, and supply chain performance. By clearly defining these objectives, the manufacturing dashboard can be tailored to provide real-time insights into these critical areas.
The next step is to gather and integrate data from various sources such as production systems, supply chain management software, and quality control databases. This ensures that the dashboard provides accurate and up-to-date information. Data integration can be a complex task, as different systems may use different data formats and protocols. However, with the help of modern integration tools and technologies, this challenge can be overcome.
Integrating data from different sources requires careful consideration of data quality and consistency. Inaccurate or incomplete data can lead to misleading insights and incorrect decision-making. Therefore, it is important to establish data governance practices and implement data cleansing and validation processes to ensure the reliability of the dashboard.
One common challenge is user resistance. Employees may be hesitant to embrace new technologies and change their established workflows. To address this, it is important to involve key stakeholders from the beginning and communicate the benefits of the dashboard. Training and support programs can help employees understand how the dashboard can improve their work and decision-making processes.
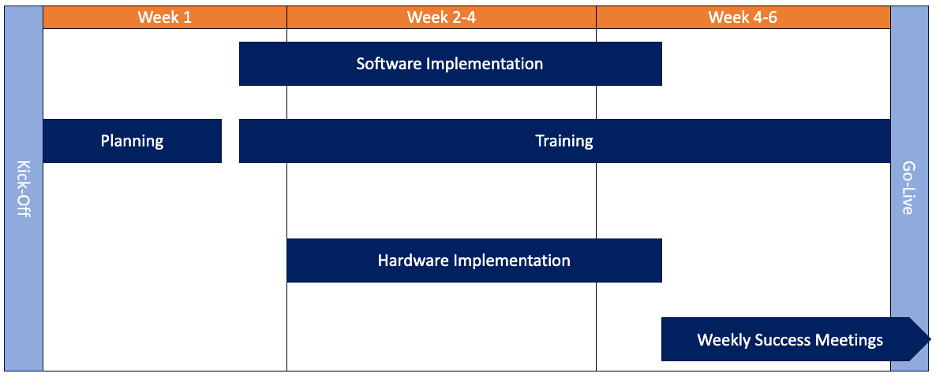
Data security is another critical challenge in implementing manufacturing dashboards. As the dashboard collects and displays sensitive data, it is important to ensure that proper security measures are in place. This includes access controls, encryption, and regular security audits. By addressing data security concerns, businesses can build trust and confidence in the dashboard among employees and stakeholders.
Setting up manufacturing dashboards requires careful planning, data integration, and overcoming implementation challenges. Manufacturers can maximize their benefits by defining clear objectives, addressing user resistance and data security concerns. With real-time insights into key performance metrics, manufacturing dashboards empower businesses to make informed decisions, improve operational efficiency, and drive overall success.

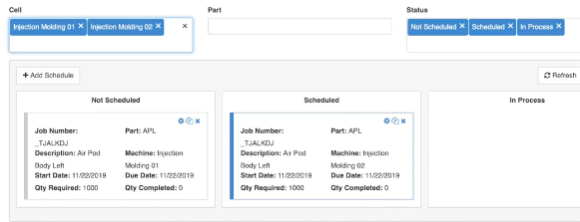
Mingo Smart Factory includes a module within the dashboard that can track production against a schedule in real time. This schedule can be imported from your existing ERP system or an Excel file. A production schedule can also be manually added and edited within the Mingo dashboard.
Production metrics can be broken down by location, line and even individual machine to track job history, details, and current status. Updating the schedule within the Mingo dashboard will automatically send that information to the operator so they know the job details for what to work on next.
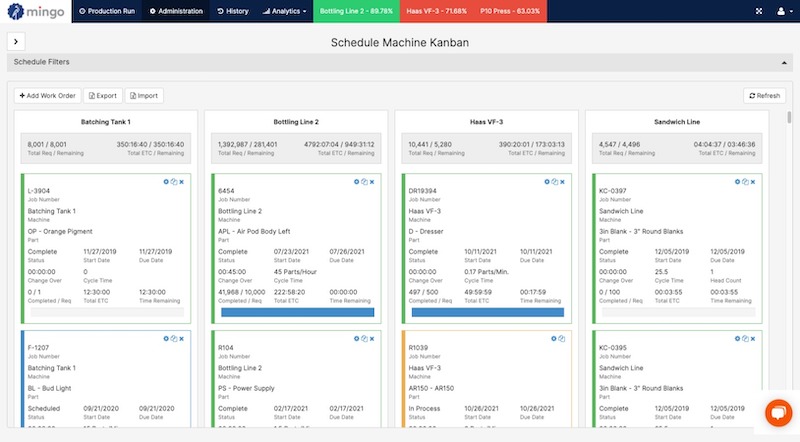
With Mingo Smart Factory’s dashboard, everyone can view the manufacturing analytics to see the plant’s efficiency, availability and performance cost. If the issue is availability, then supervisors can see the production monitoring system data in a visual format and make adjustments in real time. This allows them to shift staff to be more available throughout the shift. That way, orders can be run as fast or faster than was quoted to the customers.
Some of Mingo Smart Factory’s customers post these scoreboards on screens on the factory floor so workers can keep an eye on their OEE and line efficiencies. The system can be set up to send out automated alerts when a machine is outside its set parameters or is down for an extended period for no documented reason.

“The software we were using before was very rigid and it took a lot of manipulation to get exactly what we needed. But with Mingo it’s changed my day to day because I can tell it, ‘Send me the data in XYZ Format,’ and it does it every day right to my inbox. I get what I need, and that part of my day is done.”
Sr. Operations Analyst, Louisiana Fish Fry
Manufacturing dashboards are powerful tools that can boost efficiency and performance in the manufacturing industry. As technology continues to advance, the future of manufacturing dashboards holds immense potential, shaping a more efficient and productive manufacturing landscape.
The future of manufacturing dashboards looks promising, with emerging trends in technology paving the way for exciting possibilities. One of these trends is integrating the Internet of Things (IoT) devices into manufacturing processes. IoT devices can provide real-time data and enable predictive analytics, enhancing the capabilities of manufacturing dashboards.
1. Artificial Intelligence and Machine Learning: AI and ML algorithms can analyze vast amounts of data and provide actionable insights, further optimizing production and improving decision-making.
2. Interconnected Software: As manufacturing processes become increasingly digitized and interconnected, manufacturing dashboards will continue to evolve and adapt. Predictions for future dashboard developments include enhanced data visualization techniques, augmented reality (AR) integration, and advanced predictive analytics.
3. Real-time remote monitoring: Remote monitoring capabilities will be continue to advance. These changes will allow businesses to monitor equipment performance from anywhere. They can easily facilitate proactive maintenance and issue resolution from anywhere.


Additive manufacturers can improve efficiency, reduce waste, and boost overall performance by incorporating lean principles.

While digital twins provide real-time data visualization, their complexity can create a lag in actionable insights.

Sustainability through lean manufacturing principles activates a vein of untapped cost savings and green benefits.
Built by people who know manufacturing, Mingo Smart Factory provides the 21st century “Smart Factory” experience that manufacturers need to grow in a modern environment. See how it can help you drive revenue.
© Copyright 2025 Mingo Smart Factory » Privacy