Automotive
Versatech Increased OEE 30%
Consumer Package Goods
Oral Biotech Eliminated Scrap
Food/Beverage
Louisiana Fish Fry Increases OEE 12%
Metal Stamping
H&T Waterbury Reduced Downtime 71%
Blow Molding
Lyons Blow Molding Automated Reporting & Labeling
Cycle time is a contentious topic, not because it doesn’t provide value to manufacturers, but because the definition is widely debated. Every manufacturer defines and measures it differently, adding to the confusing nature of applying the same standard from one company to another.
Having an accurate cycle time can also be difficult to calculate based on the many moving parts happening on the factory floor. One set of standards may not be the same six months from now.
Setting up a production monitoring system that will automatically collect data and update cycle times based on real time data is the key to success.
Manufacturing cycle time is best defined as essential manufacturing KPI to understand in manufacturing. It is used by ERP and MES systems for scheduling, purchasing and production costing. It is also a critical part of the OEE calculation (use our OEE calculator here). Fortunately, it is easy to calculate and understand.
(Don’t get Cycle Time confused with Takt Time, though, which is a pretty common mistake.)
Cycle Time: This is how long it takes to make a part or how long it takes the machine to complete a cycle. Some machines produce multiple parts per cycle while others only produce one.
Cycle times can be expressed in many different units of measure below are a few of the most common and what you find in many manufacturing analytics systems like Mingo Smart Factory.
From the list above, it may seem like there are 6 different formulas but there are really only 2:
There are two components of the formula:
Total Parts Produced: Including scrap and good parts
Production Run Time: How long the machine is running when the parts are produced (Do not include planned or unplanned downtime)
Accurate cycle times are the key to success for manufacturers. It sets the standard for how efficient each line is running. Real time data is need to ensure that this time is accurate. Many of Mingo Smart Factory’s customers find that their established cycle times are off by as much as 20%.
Here are some helpful guides on how to calculate cycle time within other software packages.
Total Parts Produced / Production Run Time = Actual Cycle Time (parts/min)
Parts per Time Period Cycle Time Calculation:
10 parts/min = 1,200 parts / 120 minutes
How would you calculate cycle time formula in Excel or Google Sheets? The below example is a great cycle time Excel template.
Simple Example:
Cell A24 = # of parts
Cell B24 = Minutes of production run
Cycle Time =A24/B24
This formula is useful with longer cycle times like 30 minutes per part. This is equivalent to 2 parts per hour, but more on that later.
Time Period per Part Cycle Time Calculation:
30 minutes/part = 120 minutes / 4 parts
Cycle times often need to be converted into another unit of measure. You can use the list below as a cheat sheet to convert the various formulas into parts per minute.
Minutes per Part
1 / Minutes per Part = Parts per Minute
Seconds per Part
(1 / Seconds per Part) * 60 = Parts per Minute
Parts per Second
Parts per Second * 60 = Parts per Minute
Hours per Part
(1 / Hours per Part) / 60 = Parts per Minute
Parts per Hour
Parts per Hour / 60 = Parts per Minute
Watch this 5 minute video on how to calculate cycle times in Excel and do conversions between different units of measure.
Now that you know how to calculate cycle time, let’s dive into what it is and how you can set it up to monitor production.
The rest of this resource serves as an explanation of cycle time and why the definition often varies. Then, we’ll dive into using an ideal measurement on the floor to monitor machines and the production process.
Wondering how to set cycle time and using that to measure the manufacturing process is one question we are frequently asked by customers. Consider it a “hot topic” for conversation.
Cycle times are only one component of an efficient factory floor. Data-driven decisions start with automatic data collection, real-time visibility and manufacturing analytics.
This 20 question assessment will take about five minutes and show you:
Cycle time is how long it takes to complete a job. There can be some confusion since the same term is also used to reference the entire process – from start to finish. “Why? Is that correct?”
The short answer is yes, but let’s dive into more detail.
There are typically 3 terms used to represent a cycle time. Defining those terms varies from manufacturer to manufacturer.
1. Theoretical Max Machine Cycle – Maximum number of parts a machine can produce in a particular time period
2. Target Cycle Time – Time you would need to hit to deliver a product on time to customers (or downstream processes)
3. Actual Cycle Time – Time it takes to produce an actual number of parts or complete a “cycle”
Using an example to better explain, let’s say you’re a bottling company. Using custom equipment that bottles beer, you know the machine can theoretically bottle 784 bottles per minute (theoretical max machine cycle) and that’s as fast as the filler can go. But, you know you aren’t actually bottling 784 bottles a minute. How fast does the machine really run over a period of time?
You know you only need to bottle 732 to deliver on time to your customers (target cycle time) but are you hitting that target? Based on production numbers, you determine you’re only bottling 711 bottles per minute (actual cycle time).
That’s the difference between the 3 terms. Now, you may begin to understand why using a blanket term of “cycle time” to describe the production process can be confusing if the KPIs aren’t clearly defined.
In another example, you are a furniture manufacturer. The company you work for makes desks for elementary schools. If you can make 15 desks an hour, you will be able to deliver on time to the schools (target cycle time). But, in theory, your machines and people are capable of making 20-30 per hour (theoretical max machine cycle).
In the end, you only need to produce 15 to meet demand. But, again, you determine you’re making less than the target. In fact, you’ve only made 10 desks (actual cycle time). This indicates a much larger problem that needs to be addressed in order to meet demand.
There may be other processing problems going on that are slowing things down. Do you have enough products to make a completed desk? Do you have enough people on the line? Is the machine available to run? Do you have boxes to send the desks to the schools in?
These are all questions you can ask yourself to get to the root of the problem. And without calculating cycle time, you would be left in the dark about where the problem(s) truly lies.
Knowing the differences between the terms is only half the battle. It’s also important to know which ones you should use and when. This is where it’s essential to understand what you’re actually measuring and why.
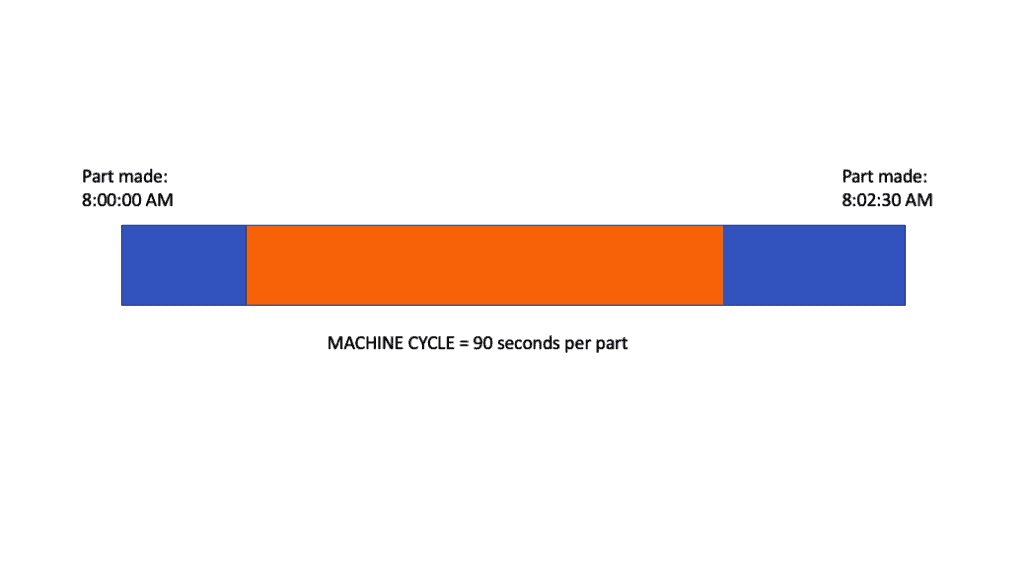
Most people think cycle time is actually the same as the machine cycle, but this does not represent the entirety of a process. It’s more important to look at the complete process (aka looking beyond just the machine cycle). This includes the time it takes for an operator to load a job, the time and effort it takes to get the machine up and running, unloading the part or adding finishing touches by hand once the part has been made.
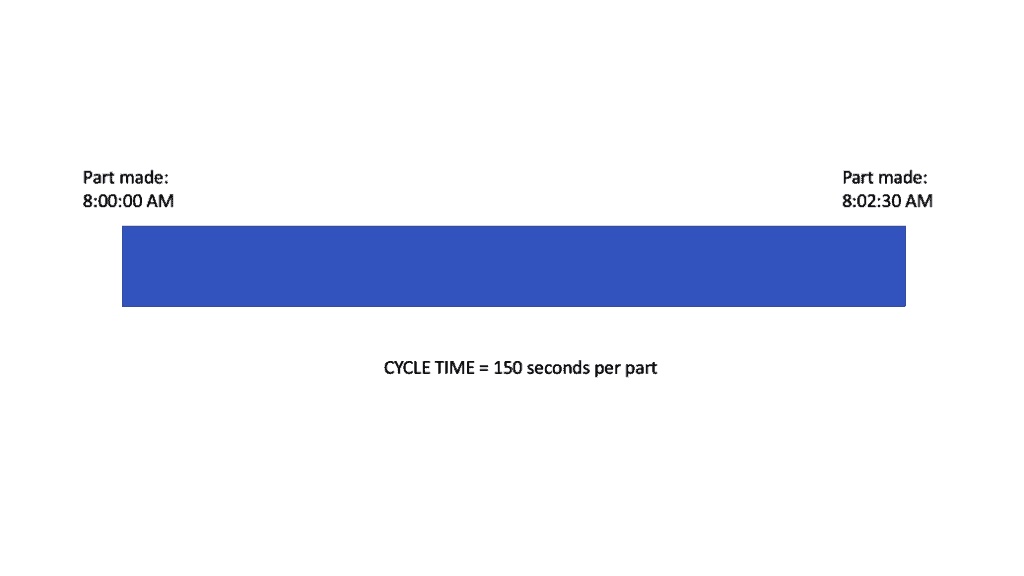
The images below provide a visual representation of why measuring the cycle time of a process is more valuable than measuring just the machine cycle.
The orange portion for example #1 is likely what you, and many other manufacturers, think represents the cycle time. You could make 200 parts, but you probably didn’t take into account the manual actions the operator needs to do to get it up and running in the first place. If that’s the case, you will have over-estimated the amount of product that can be made in a given period.
It’s important to look at the process in a way that includes all factors, not just the making of a product by a machine which is where example #2 comes into play.
Example #2 is good for making estimates because it shows how fast you are capable of running (from start to finish), and will, in turn, give you a target cycle time that is easier to hit and measure. Then, you can use that number to calculate how much product you’re actually making and if there are problems or issues that need addressing.
Let’s be the devil’s advocate for a moment. Some manufacturers may only want to look at the machine cycle. Specifically, how close are you getting to removing the blue parts of this cycle? Not to sound repetitive, but this severely limits your ability to measure the process as a whole.
Do you want to measure the time it takes to produce just the part in the machine (machine cycle) or the entirety of the process to determine what’s actually possible (cycle time)? If you said the latter, yes, that’s what would recommend, too.
At this point, you likely know which metric we believe in measuring, but for the sake of driving the point home, we suggest measuring the entirety of the cycle and referring to that as the ideal cycle time.
Think of it in terms of the bottling example used above. If you’re only evaluating the machine cycle, then you’ll only know how long it takes to fill the bottle and cork it. This is the work done by only the machine.
But, if you’re using complete cycle time of the process, you not only know how long it takes to fill the bottle and cork it. You will also know how long it takes people to load and unload the bottles, box the product, and send it to the delivery area.
If you’re truly trying to understand how much beer can be bottled per minute, per hour, or whatever the preferred time frame is, you have to include the role people play in producing the product. That will give you a complete picture of how long it takes to get the product out the door.
When you look at the complete process, this helps you estimate how many parts you can make in a day, realistically. You don’t really want to use the machine cycle because it will give you an overly optimistic view that you’ll never be able to hit.
If 80% is the highest machine performance that can be achieved, this doesn’t bode well for morale on the floor. Your employees will never hit their numbers because the goal is based solely on the time it takes for just the machine to run. They need to also keep in mind other factors that contribute to the production of a part. If there’s a goal that can never really be met, employee engagement will decrease leading to negative employee experiences and unfavorable company culture.
Easy to use, fast to implement, and customizable to help manufacturers get accurate cycle times for each individual line on the factory floor.
Which brings you, and all manufacturers, to the point where an important decision needs to be made.
“I know how to calculate my cycle time. I have a line. Do I want to set my ideal cycle time to the entire process or what the machine is actually capable of producing?”
In the archetypical Lean organization, manufacturers use cycle time to determine where the production process may be falling short. That’s where the difference between the target and actual cycle time comes into play. Do you need additional help on the line? Can you figure out where the bottlenecks are? Do you need an additional station to meet demand?
This is all very important because, in the end, customer demand enables manufacturers to appropriately schedule production. One cannot be without the other.
If you expect customers to go through X amount of product, you need to figure out how often you have to run the job, per day, in order to meet that demand.
The ideal cycle time, not the theoretical maximum of the machine, will help you determine how best to measure and utilize the machine (and people) on your line. Using that knowledge, you can determine you only need to run the job for 2 hours tomorrow and 2 hours the next day to meet demand.
To recap, there are 2 core concepts in determining how you want to calculate and measure cycle time.
1. Do you want to measure it based on how many parts the machine can theoretically make (theoretical max machine cycle)
2. Do you want to measure how long it actually takes (target cycle time) to meet customer demand and use that, coupled with actual cycle time, to identify any inefficiencies?
Think about what your timeline looks like at the end of the day. Does it include the setup time or the first 60 minutes of a production run as downtime? Do you estimate the number of parts needed to meet demand?
If you’re not including that setup time or any other non-value-added process, you’re missing out on a crucial opportunity. Give your employees an accurate representation of how much needs to be produced per minute, hour, or shift. This will allow them to accurately measure the whole process.
An example is the best way to drive the point home. If you have 10 hours of operation scheduled, but 1 hour of that is allotted for a changeover, you really only have 9 hours of runtime. Theoretically, the machine can produce 12 parts, but you don’t need that many. The target cycle time is 9 parts per shift. With that knowledge, you know you need to create 1 part per hour to meet demand.
If you’re actually only creating 7, you have a problem that needs to be addressed. And that our friends, is why cycle time is important to measure and measure accurately and clearly.
Bryan Sapot is a lifelong entrepreneur, speaker, CEO, and founder of Mingo. With more than 24 years of experience in manufacturing technology, Bryan is known for his deep manufacturing industry insights.
Throughout his career, he’s built products and started companies that leveraged technology to solve problems to make the lives of manufacturers easier. Follow Bryan on LinkedIn here.
Built by people who know manufacturing, Mingo Smart Factory provides the 21st century “Smart Factory” experience that manufacturers need to grow in a modern environment. See how it can help you drive revenue.
© Copyright 2024 Mingo Smart Factory » Privacy