Overall Equipment Effectiveness (OEE) is a comprehensive metric that provides insights into how well manufacturing operations are performing relative to their full potential. Understanding how to calculate OEE in the highly competitive automotive manufacturing industry is crucial. This article will guide you through understanding OEE, best practices for configuring equipment for OEE calculation, and the necessity of a production monitoring system like Mingo Smart Factory to provide real-time data for accurate reporting. We will also discuss the advantages of working with a smart factory system for OEE calculation.
Overall Equipment Effectiveness (OEE) is a standard for measuring manufacturing productivity. It identifies the percentage of manufacturing time that is truly productive. An OEE score of 100% represents perfect production: manufacturing only good parts, as fast as possible, with no downtime. The benchmark for world-class OEE is considered to be 85%.
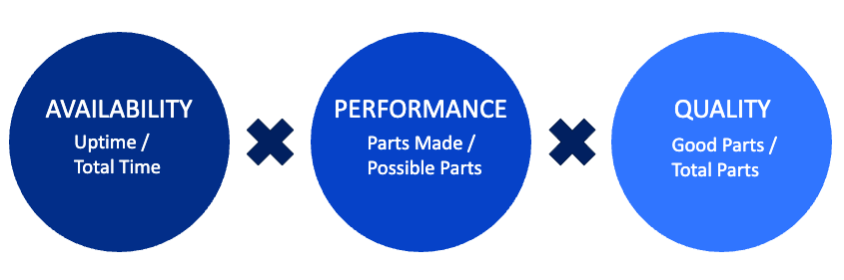
Components of OEE
OEE is calculated by multiplying three components: Availability, Performance, and Quality.
Availability: This measures the percentage of scheduled time that the equipment is available for production. It accounts for downtime, including both planned (e.g., maintenance) and unplanned (e.g., equipment failures) stoppages. Where Run Time is Planned Production Time minus Downtime.
Performance: This measures the speed at which the equipment operates as a percentage of its designed speed. It accounts for any factors that cause the process to run at less than the maximum possible speed, including slow cycles and small stops. Where Ideal Cycle Time is the fastest cycle time that your process can achieve.
Quality: This measures the percentage of good parts out of the total parts produced. It accounts for defects and rework.
Combining these three components gives the OEE score:
Best Practices for Configuring Equipment for OEE Calculation
To accurately calculate OEE in the automotive industry, it is essential to configure your equipment and data collection processes correctly. Here are some best practices:
Standardize Definitions and Measurements: Ensure that all relevant teams have a unified understanding of the terms and measurements used in OEE calculations. This standardization prevents inconsistencies and ensures that everyone is working with the same data.
Use Automated Data Collection: Manual data collection can be prone to errors and inconsistencies. Automating data collection ensures accuracy and allows for real-time monitoring. Smart factory systems like Mingo Smart Factory can collect data directly from machines, reducing the risk of human error.
Categorize Downtime Events: Clearly define and categorize downtime events. This will help in accurately measuring availability. For instance, differentiate between planned maintenance, unplanned breakdowns, and minor stops.
Monitor Cycle Times: Regularly monitor and record cycle times for each piece of equipment. Knowing the ideal cycle time is crucial for calculating performance accurately. Any deviation from the ideal cycle time should be analyzed to identify underlying issues.
Track Defects and Rework: Keep a detailed record of defects and rework. This data is essential for calculating the quality component of OEE. Implement processes for identifying, categorizing, and addressing defects to continuously improve quality.
Impact of Real-Time Data Collection
In the dynamic environment of automotive manufacturing, real-time data collection is paramount. Real-time data allows for immediate insights and swift responses to any discrepancies or inefficiencies in the production process. Here’s why real-time data collection is crucial:
Instantaneous Issue Detection: Real-time data collection enables the identification of problems as they occur, allowing for prompt corrective actions. This minimizes downtime and maintains a smooth production flow.
Enhanced Decision-Making: Access to up-to-the-minute data helps plant managers and executives make informed decisions quickly, improving overall operational efficiency.
Proactive Maintenance: Monitoring equipment performance in real-time aids in predictive maintenance, preventing unexpected breakdowns and extending the lifespan of machinery.
Optimized Resource Utilization: Real-time data helps in the optimal allocation of resources, ensuring that labor, materials, and machinery are used efficiently.
Advantages of a Manufacturing Dashboard
An effective manufacturing dashboard is essential for translating raw data into actionable insights. Here are the key advantages of using a manufacturing dashboard:
User-Friendly Interface: A well-designed dashboard provides an intuitive interface that is easy to navigate, making it accessible to all levels of staff.
Centralized Data: It consolidates data from various sources into a single platform, providing a holistic view of the manufacturing process.
Automatic Reporting: The ability to generate automatic reports saves time and reduces the risk of human error, ensuring that data is always accurate and up-to-date.
Real-Time Monitoring: Dashboards offer real-time monitoring of key performance indicators (KPIs), enabling swift action on any issues.
Customization: Customizable dashboards allow users to focus on the most relevant metrics for their specific roles, enhancing productivity and focus.
Implementing Production Monitoring for Seamless Operations
Production monitoring is at the heart of maintaining an efficient, calm, and controlled manufacturing environment. Integrating OEE calculations with real-time data collection and a comprehensive manufacturing dashboard ensures seamless operations. Here’s how:
Training and Support: Provide adequate training for staff to effectively use the dashboard and interpret the data. Continuous support is also crucial for addressing any technical issues promptly.
Continuous Improvement: Use the insights gained from the dashboard to implement continuous improvement initiatives. Regularly review and refine processes to maintain high OEE scores.
Collaboration and Communication: Foster a culture of collaboration and open communication among team members. A shared understanding of goals and metrics enhances accountability and drives collective success.
Case Study: Enhancing OEE in an Automotive Manufacturing Plant
With automated, real-time data and visual dashboards, Versatech increased OEE 30% by finding problems, solving them quickly, and continuously improving processes. Versatech was able to use Mingo to look at downtime time and quickly solve issues as well as recognize negative trends. Check out the full case study.
“Overall, the highlight was being able to see the trends in data and being able to access this data at any time in easy-to-use dashboards. We used to look at trends by using Excel; Mingo has made this significantly better and easier.”
Scott Strutner, Versatech Manufacturing Engineer
Step-by-Step Implementation
Assessment and Planning: Conduct a thorough assessment of current processes and identify key areas for improvement. Develop a detailed implementation plan for the new system.
Technology Integration: Integrate IoT sensors with existing machinery to collect real-time data on performance, availability, and quality.
Dashboard Configuration: Customize the manufacturing dashboard to display relevant KPIs, such as OEE, cycle time, and defect rates.
Training: Provide extensive training for operators, supervisors, and managers to ensure they understand how to use the new system effectively.
Monitoring and Adjustment: Continuously monitor the system’s performance and make necessary adjustments to optimize its functionality.
Results
By leveraging real-time data and an intuitive manufacturing dashboard, the plant achieved the following results within six months:
Increased Availability: Downtime was reduced by 20%, leading to higher machine availability.
Improved Performance: Optimized cycle times increased overall production speed by 15%.
Enhanced Quality: The defect rate was reduced by 10%, resulting in higher quality outputs.
Higher OEE: The plant’s OEE score improved from 70% to 85%, reaching world-class performance levels.
The Importance of Calculating OEE for Automotive Manufacturers
Calculating OEE for automotive manufacturers is essential for maintaining high efficiency and competitiveness. By understanding the components of OEE—Availability, Performance, and Quality—plant managers can pinpoint areas for improvement. The importance of real-time data collection cannot be overstated, as it allows for immediate insights and proactive management of the production process.
Utilizing an intuitive manufacturing dashboard that integrates seamlessly with existing systems and generates automatic reports enhances visibility and accountability. This holistic approach to production monitoring ensures that automotive manufacturers can maintain calm and control on the factory floor, driving positive revenue and achieving operational excellence.
Investing in these technologies and practices not only boosts OEE but also fosters a culture of continuous improvement and collaboration. As the automotive manufacturing industry continues to evolve, those who embrace these advancements will be best positioned for sustained success and growth.
Digital Marketing Manager @ Mingo Smart Factory I Adjunct Professor @ SUNY Geneseo I Boston Marathoner I Second Street Award Winner I Media Professional with 15 Years Experience