
The beverage manufacturing industry is a dynamic and highly competitive sector that demands precision, efficiency, and consistent quality. From soft drinks and bottled water to alcoholic beverages, manufacturers must balance high production volumes with stringent quality control measures. In an industry where consumer preferences can shift rapidly and regulatory standards are strict, optimizing operational efficiency is crucial. Overall Equipment Effectiveness (OEE) is a critical metric for beverage manufacturers aiming to enhance productivity, reduce waste, and maintain high standards of quality.
OEE provides a comprehensive view of how effectively manufacturing equipment is utilized. By identifying and addressing inefficiencies, beverage manufacturers can improve their production processes, reduce downtime, and ensure that their products meet quality standards consistently. This article will guide you through understanding OEE, best practices for configuring equipment for OEE calculation, the impact of real-time data collection, the advantages of a manufacturing dashboard, implementing production monitoring for seamless operations, a step-by-step implementation process, and the potential results of accurate OEE measurement in the beverage manufacturing industry.
Understanding Overall Equipment Effectiveness (OEE)
Overall Equipment Effectiveness (OEE) is a standard for measuring manufacturing productivity. It identifies the percentage of manufacturing time that is truly productive. An OEE score of 100% represents perfect production: manufacturing only good parts, as fast as possible, with no downtime.
Components of OEE
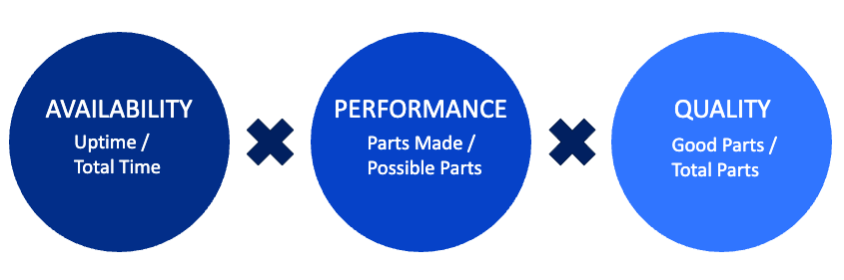
OEE is calculated by multiplying three components: Availability, Performance, and Quality.
- Availability: This measures the percentage of scheduled time that the equipment is available for production. It accounts for downtime, including both planned (e.g., maintenance) and unplanned (e.g., equipment failures) stoppages. Where Run Time is Planned Production Time minus Downtime.

- Performance: This measures the speed at which the equipment operates as a percentage of its designed speed. It accounts for any factors that cause the process to run at less than the maximum possible speed, including slow cycles and small stops. Where Ideal Cycle Time is the fastest cycle time that your process can achieve.

- Quality: This measures the percentage of good parts out of the total parts produced. It accounts for defects and rework.

Combining these three components gives the OEE score:
Best Practices for Configuring Equipment for OEE Calculation
To accurately calculate OEE, it is essential to configure your equipment and data collection processes correctly. Here are some best practices tailored for the beverage industry:
- Standardize Definitions and Measurements: Ensure that all relevant teams have a unified understanding of the terms and measurements used in OEE calculations. This standardization prevents inconsistencies and ensures that everyone is working with the same data.
- Use Automated Data Collection: Manual data collection can be prone to errors and inconsistencies. Automating data collection ensures accuracy and allows for real-time monitoring. Smart factory systems like Mingo Smart Factory can collect data directly from machines, reducing the risk of human error.
- Categorize Downtime Events: Clearly define and categorize downtime events. This will help in accurately measuring availability. For instance, differentiate between planned maintenance, unplanned breakdowns, and minor stops.
- Monitor Cycle Times: Regularly monitor and record cycle times for each piece of equipment. Knowing the ideal cycle time is crucial for calculating performance accurately. Any deviation from the ideal cycle time should be analyzed to identify underlying issues.
- Track Defects and Rework: Keep a detailed record of defects and rework. This data is essential for calculating the quality component of OEE. Implement processes for identifying, categorizing, and addressing defects to continuously improve quality.
Impact of Real-Time Data Collection
Real-time data collection is critical for accurate OEE measurement and continuous improvement in beverage manufacturing. It allows manufacturers to capture and analyze data as it happens, providing immediate insights into production performance.
Benefits of Real-Time Data Collection
- Immediate Issue Identification: Real-time data collection enables immediate identification of issues, such as equipment malfunctions or production bottlenecks. This allows for quick corrective actions, minimizing downtime and maintaining high levels of productivity.
- Accurate Data: Automated, real-time data collection reduces the risk of human error and ensures that the data is accurate and up-to-date. This accuracy is essential for reliable OEE calculations and informed decision-making.
- Enhanced Decision-Making: Access to real-time data allows managers to make informed decisions based on current production conditions. This responsiveness leads to more effective management of resources and processes.
Advantages of a Manufacturing Dashboard
A manufacturing dashboard is a powerful tool for visualizing and analyzing real-time data. It consolidates key metrics and performance indicators into a single, easy-to-understand interface, providing a comprehensive overview of manufacturing operations.
Key Features of a Manufacturing Dashboard
- Real-Time Updates: Manufacturing dashboards provide real-time updates on production performance, allowing managers to monitor operations continuously and respond quickly to any issues.
- Customizable Views: Dashboards can be customized to display the most relevant metrics and performance indicators for specific roles or processes. This ensures that users have access to the information they need to make informed decisions.
- Data Visualization: Visual representations of data, such as charts and graphs, make it easier to identify trends, patterns, and anomalies. This visual clarity helps managers understand complex data and make better decisions.
- Alerts and Notifications: Dashboards can be configured to send alerts and notifications for specific events, such as equipment downtime or deviations from expected performance. This proactive approach helps prevent issues before they escalate.
Implementing Production Monitoring for Seamless Operations
Implementing a production monitoring system like Mingo Smart Factory can transform beverage manufacturing operations, providing real-time insights and enhancing efficiency.
Step-by-Step Implementation
- Assessment and Planning: Begin by assessing your current production processes and identifying areas for improvement. Develop a plan for implementing the production monitoring system, including goals, timelines, and resource requirements.
- Integration with Equipment: Integrate the production monitoring system with your existing equipment and systems. This may involve installing sensors and data collection devices, configuring software, and ensuring compatibility with your machinery.
- Data Collection and Analysis: Start collecting real-time data from your production processes. Use the system’s analytics tools to analyze the data and identify trends, patterns, and areas for improvement.
- Training and Support: Provide training and support for your team to ensure they understand how to use the production monitoring system effectively. This may include training sessions, user manuals, and ongoing technical support.
- Continuous Improvement: Use the insights gained from the production monitoring system to implement continuous improvement initiatives. Monitor the impact of these initiatives and make adjustments as needed to optimize performance.
Potential Results of Accurate OEE Measurement in the Beverage Manufacturing Industry
Accurate OEE measurement can have a profound impact on beverage manufacturing operations, leading to significant improvements in efficiency, productivity, and overall performance.
Key Benefits
- Increased Efficiency: Accurate OEE measurement helps identify inefficiencies in production processes, allowing for targeted improvements that increase overall efficiency. This can lead to higher production rates and reduced waste.
- Reduced Downtime: By identifying and addressing the root causes of downtime, manufacturers can minimize equipment failures and unplanned stoppages. This leads to higher availability and more productive manufacturing operations.
- Improved Quality: Monitoring and analyzing quality data helps identify defects and rework, enabling manufacturers to implement quality control measures that reduce defects and improve product quality.
- Enhanced Decision-Making: Access to accurate, real-time data empowers managers to make informed decisions that optimize production processes and resource allocation. This leads to more effective management and better overall performance.
- Continuous Improvement: Accurate OEE measurement provides the insights needed for continuous improvement. By regularly monitoring performance and implementing targeted improvements, manufacturers can achieve sustained operational excellence.
The Importance of Calculating OEE for Beverage Manufacturers
The beverage manufacturing industry demands high standards of efficiency, quality, and responsiveness. Calculating OEE is essential for beverage manufacturers aiming to optimize their operations and stay competitive. By understanding the components of OEE, implementing best practices for equipment configuration, leveraging real-time data collection, utilizing a manufacturing dashboard, and implementing a production monitoring system like Mingo Smart Factory, manufacturers can achieve accurate OEE measurements and drive continuous improvement. The potential results are significant: increased efficiency, reduced downtime, improved quality, enhanced decision-making, and continuous improvement. Embrace the power of smart manufacturing with Mingo Smart Factory to unlock your full potential and achieve operational excellence.
Curious to see how many steps it takes to calculate OEE in Mingo Smart Factory? The answer is one. The OEE calculation is automatically done for you in the manufacturing dashboard. For more information on how Mingo Smart Factory can help your business, visit the Food and Beverage page or talk to an expert to schedule a demo.
