Reduce scrap

Without real quality measurements, scrap is just money going down the drain. 

manufacturing quality reduce scrap
data that matters

Everything You Need, Nothing You Don’t

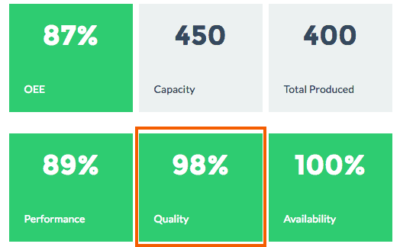
Measuring & Calculating Quality

Correctly calculating quality is essential to a reliable, realistic OEE. To calculate quality of a part, Mingo collects part counts and reject reason codes directly from the PLCs or sensors as well as from input from operators or supervisors.

This includes data taken from specialized testing equipment and data beyond reason codes such as temperature, pressure, speeds, vision systems, and any other data points accessible.

 
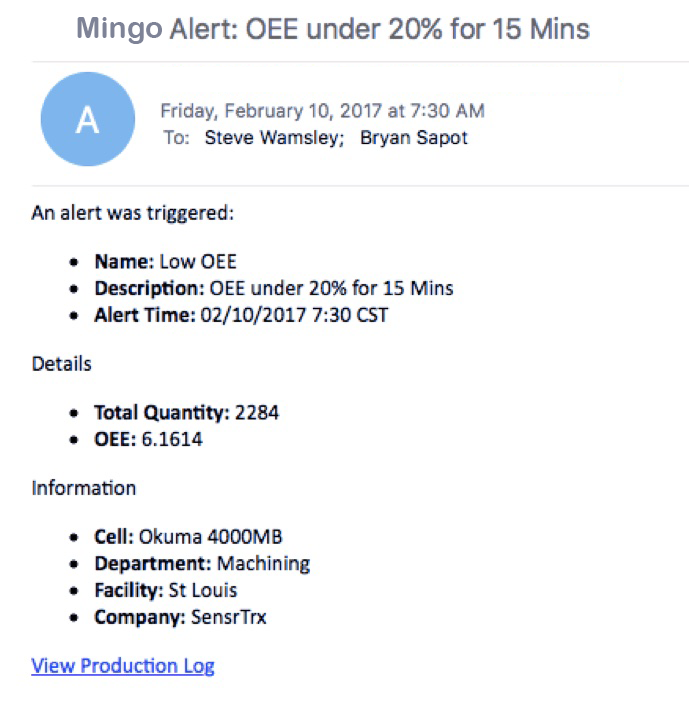
Mingo email alert

Determine the Most Common Causes of Scrap and Get Alerts

Get alerts directly to your mobile phone or via manufacturing insights emails when scrap is higher than normal, giving you the ability to prevent issues from becoming worse.

Use Pareto Charts to help determine the most common causes of scrap. When you know common causes, you can use trend analysis to determine how the plant is running.

CASE STUDY

Oral BioTech Saw a 99.8% Reduction in Scrap Rate by Getting Visibility

Understand Scrap Trends

Track trends in your data to see how your plant is running, both in real-time and over an extended period of time.

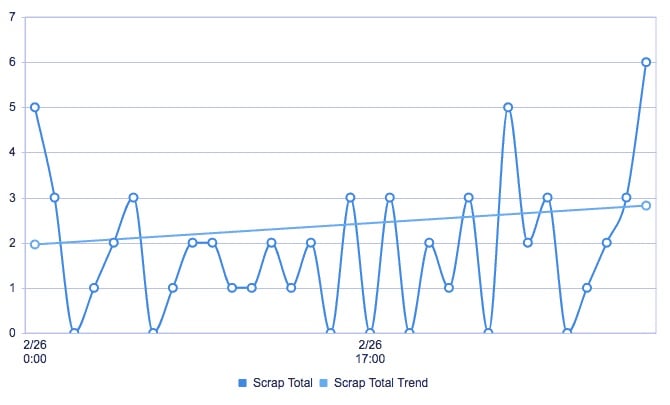
Look at scrap by the number of times a scrap reason occurred, average number of scrapped parts per entry, total number of scrapped parts by reason code, or even by shift to determine if one shift has more scrap than another.

Using trends, you can easily see the effect of process or system changes over the long term. You can see when scrap is increasing or decreasing and quickly take action to resolve the issues.

Scrap Trends

Explore More Features

Mingo is the smartest and most complete analytics and productivity platform for growing manufacturing businesses. With solutions so effective, you’ll wonder how you ever ran your factory without it.

Real-Time Visibility

Alerts

Get notified now of issues in the plant, don't wait until tomorrow.

Scoreboard

Overhead visual management tool showing real time work center status.

Operator Screen

Intuitive interface to understand where you are now, and enter data like downtime change overs, scrap, and quality.

Automated Data Collection

Collect data automatically from any machine new or old. Replace Excel, paper, and whiteboards.

Operational Awareness

Dashboards

Customizable easy to use dashboards give you the information need to run the plant on a day to day basis.

Automated Reporting

Automatic end of shift, end of day, or end of week reporting right in your inbox.

Scheduling & Management

Integrate your schedule and know if you will hit your due dates before its a problem.

Labor Tracking

Track who worked on what work orders and when. Improve costing and training.

Intuitive Analytics

Dashboards

View and summarize data by week, month, and year.

Pivot Tables

One of Excel's most popular features built right into Mingo. No need to export.

Integrations

Open API to connect with ERP, Maintenance Manage or any other software.

Process Data

Collect and correlate any data with production runs, speed, pressure, temperature, weights.