data that matters

Everything You Need, Nothing You Don’t

Measuring Throughput

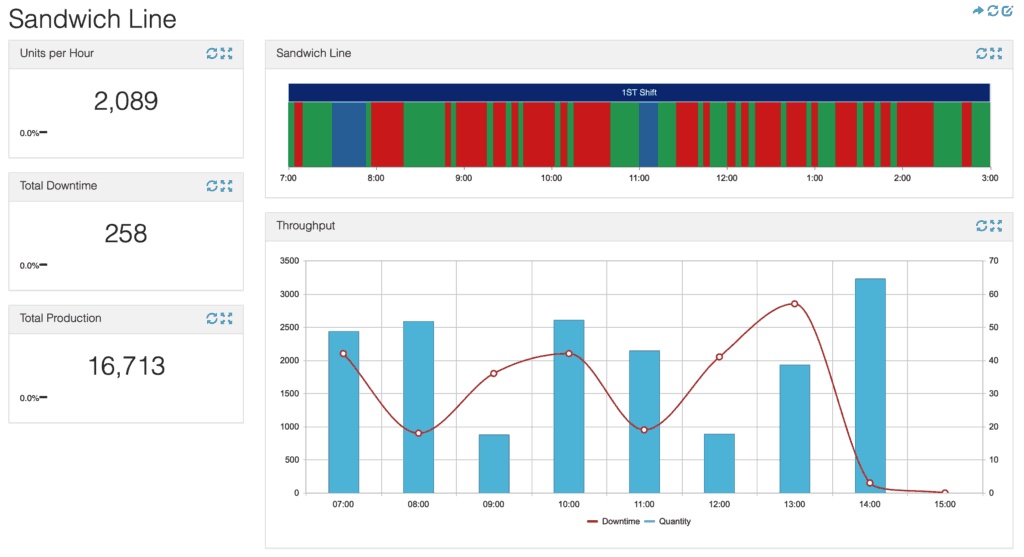
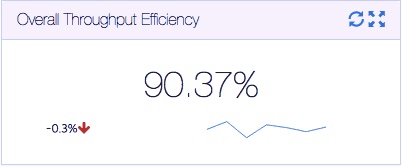
Performance measures the actual cycle time vs. the ideal cycle time. To calculate performance, Mingo Smart Factory collects part or product counts from the machines and compares them against the ideal cycle time. This data is collected from the existing controls, PLCs, or sensors on the machine or production line.

To stop problems as they happen, receive alerts to your mobile phone or via manufacturing insights emails when cycle times or throughput are higher or lower than normal.

Increase Throughput Efficiency

Find Opportunities for Improvement

Look at throughput and performance by shift to look for opportunities for improvement. Many times, different shifts run machines and production lines slower or faster than others. One shift will figure out how to do something better or faster but neglect to share it with the other shift leaders.

Using the data, find opportunities to share knowledge and improve performance.

CASE STUDY

Reducing a 14-Week Backlog to Gain Half a Million Dollars in Revenue

Understand Performance Trends

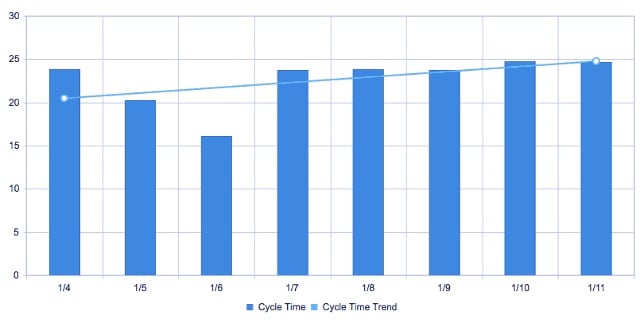
Track trends in your data so you can see, over time, how your plant is running. Using trends, you can easily see the effect of process or system changes over the long term.

Mingo allows manufacturing companies to collect and analyze data in a way that was not possible a few years ago. Companies no longer have to rely on paper, Microsoft Excel, or complicated ERP systems to analyze data from the plant floor.

Cycle Time Trends: Increase Throughput

Explore More Features

Mingo is the smartest and most complete analytics and productivity platform for growing manufacturing businesses. With solutions so effective, you’ll wonder how you ever ran your factory without it.

Real-Time Visibility

Alerts

Get notified now of issues in the plant, don't wait until tomorrow.

Scoreboard

Overhead visual management tool showing real time work center status.

Operator Screen

Intuitive interface to understand where you are now, and enter data like downtime change overs, scrap, and quality.

Automated Data Collection

Collect data automatically from any machine new or old. Replace Excel, paper, and whiteboards.

Operational Awareness

Dashboards

Customizable easy to use dashboards give you the information need to run the plant on a day to day basis.

Automated Reporting

Automatic end of shift, end of day, or end of week reporting right in your inbox.

Scheduling & Management

Integrate your schedule and know if you will hit your due dates before its a problem.

Labor Tracking

Track who worked on what work orders and when. Improve costing and training.

Intuitive Analytics

Dashboards

View and summarize data by week, month, and year.

Pivot Tables

One of Excel's most popular features built right into Mingo. No need to export.

Integrations

Open API to connect with ERP, Maintenance Manage or any other software.

Process Data

Collect and correlate any data with production runs, speed, pressure, temperature, weights.