Automotive
Versatech Increased OEE 30%
Consumer Package Goods
Oral Biotech Eliminated Scrap
Food/Beverage
Louisiana Fish Fry Increases OEE 12%
Metal Stamping
H&T Waterbury Reduced Downtime 71%
Blow Molding
Lyons Blow Molding Automated Reporting & Labeling
Read on to learn more about this single metric to measure machine effectiveness.
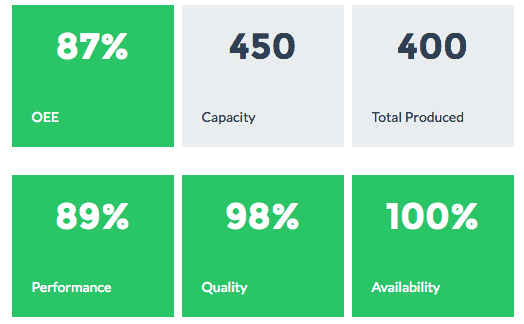
OEE (Overall Equipment Effectiveness) is an attempt to combine the many complex factors involved in manufacturing into a single metric to measure machine effectiveness. OEE is a measure of performance, availability, and quality. Using this number, operators and managers can quickly see how a machine or cell is performing and track how efficiently a machine, cell, or part can be produced.
Overall Equipment Efficiency is a great standard for improving and monitoring processes. It helps companies quickly and easily identify issues on production lines and equipment on the plant floor. But as smart manufacturers already know, it does not tell the whole story and can also be very flawed. Many people believe that OEE is a magic number and when implemented properly your operations magically improve. In this post, we discuss:
I will leave it to you to decide if it is magic.
As I mentioned above Overall Equipment Effectiveness has three components Availability, Performance, and Quality. Below is a definition of each and how they create critical visibility into a machine or cell.
The performance portion of the calculation is a measure of the actual parts produced against the standard. The standard is the ideal number of parts a machine can produce in a certain amount of time. Because most machines are scheduled using the standard, this is an important measure. If the machine is producing too far below the standard, the schedule won’t be met. If it is producing above the standard, you may have excess capacity.
Mingo Smart Factory can track what actually happened on the shop floor rather than what is supposed to happen. For example, two operators may report downtime differently. John may report a 2 minute 30-second downtime event as 2 minutes and Mary may report it like 2 minutes 45 seconds. Using automated data collection, you gain visibility into slowdowns, data that is not easy to gather with manual data collection methods. Using this data, managers can quickly determine bottlenecks and other areas for improvement.
Visibility into OEE downtime creates accountability and drives process improvement.
OEE calculations provide insight into the overall performance of a machine, a line, and a plant.
Already have an ERP system? While performance is automatically calculated in Mingo’s dashboard, we have created quick guides for how to calculate performance in other ERP systems:
The quality metric is the simplest of the three, it is the ratio of good parts to bad parts. Most organizations will track reason codes with the scrap to understand how to reduce scrap in the future.
Tracking scrap is a core part of the manufacturing process. Using Mingo Smart Factory and Overall Equipment Effectiveness, you can easily track scrap counts, reason codes and use the collected in root cause analysis. Quality is a core component of the OEE calculations that shows operators and managers how they are doing against the goal.
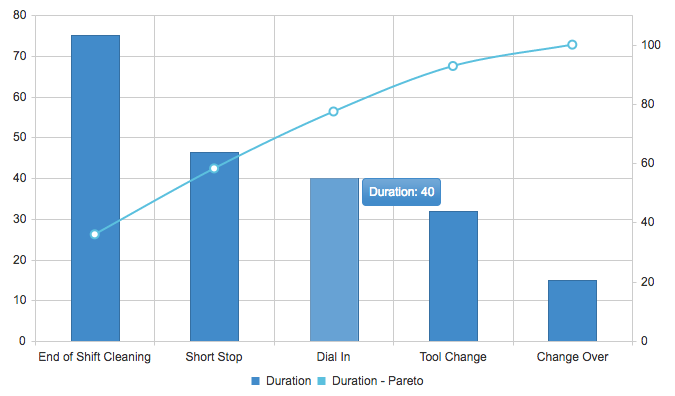
Availability is a single number representing how much time a machine can run. This metric takes into account planned and unplanned maintenance, waiting, changeovers, and lack of supply. Using reason codes to track downtime, companies can determine root causes and develop corrective actions to stop these issues from occurring in the future.
Setup and change over time have a huge impact on overall equipment effectiveness and can bring down your OEE numbers. Operators must have a way to track how long setup and changeovers take so production time can be maximized and downtime can be reduced. Equipment failure can cause huge disruptions in production schedules. By tracking downtime reason codes and response times of maintenance teams, downtime can be reduced.
Using the three metrics above companies can use OEE to help uncover “The 6 Big Losses”. These losses are the most common reasons for reduced efficiency and capacity in a plant.
Tracking OEE and discovering when, where and under what circumstances The Big 6 are occurring can be a huge help for a manufacturing company. But there are some things to watch out for when using Overall Equipment Effectiveness.
Built by people who know manufacturing, Mingo provides the 21st century “Smart Factory” experience that manufacturers need to grow in a modern environment. See how it can help you drive revenue.
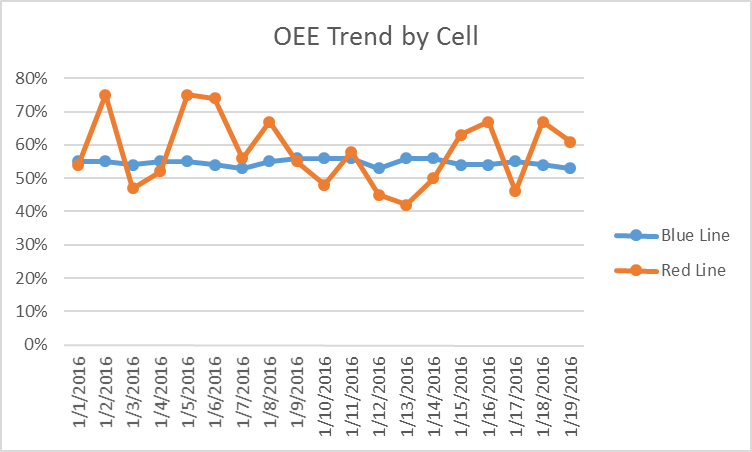
Because of the formula, Availability x Quality x Performance, any of these factors can vary and produce the same OEE number. OEE can be a very flawed metric if not understood and contextualized. For example:
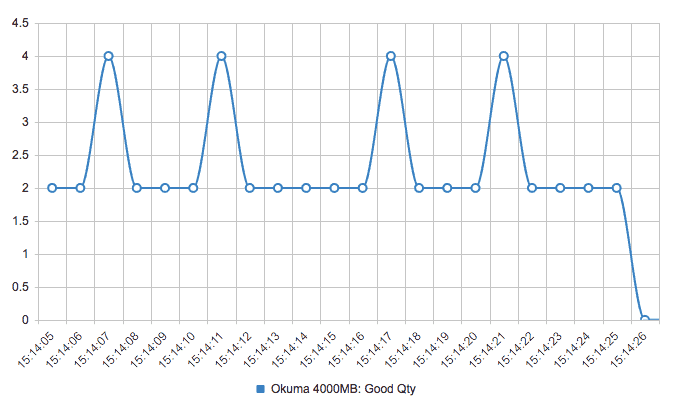
As a manager, if you saw only the OEE numbers above you would assume things are going well. In reality, the daily fluctuations are not what you want to see. As a manager, you need to focus on the trends.
Operators, on the other hand, have a better understanding of what is happening with the machine and what is causing certain numbers. Because of this, real-time numbers are very useful to an operator. It helps them understand how they are performing against the standards and where they can improve.
As a manager, would you rather have a machine that is running at a steady 54% OEE with planned downtime or a machine that one day runs at 75% and the next at 45% and has a lot of unplanned maintenance? By looking at the trends and diving into the details, management can make more informed decisions about what is right for their business and define a strategy for improvement.
Measuring Overall Equipment Effectiveness is a great thing and the visibility it creates can help improve equipment efficiency across the plant. But OEE is missing one critical element – cost. It is not a measure of the profitability of a machine. In certain situations, you may have a very low number of 30% but the machine is profitable, the converse may be true as well. A machine may run at 80% OEE but not be profitable.
Unfortunately, most companies don’t have unlimited funds to create the ideal manufacturing environment. Companies have to make a tradeoff between being efficient and being cost-effective. For example, the most efficient way to run a certain part with multiple operations is through a cell. But if that part is only run every other week? The company cannot justify setting up a dedicated cell. So the machines that run this part will have a lower OEE because of setup, change over, and startup time but will still be profitable.
The answer is – it is one of the magic numbers but not the only number that should be tracked. The visibility it creates will help the company drive improvement and measure its success. OEE should be used to follow trends and as a starting point to analyze performance, availability, and quality issues. Companies that deploy OEE must have tools to analyze the metrics that make up the overall OEE calculation.
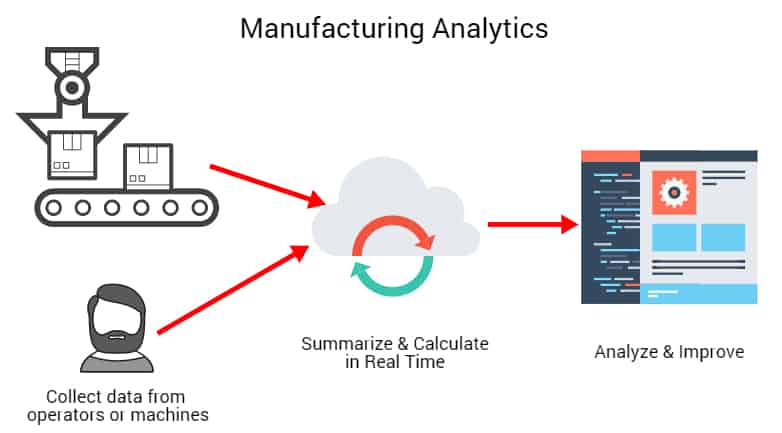
Mingo uses a combination of manual and automated data collection techniques that are configured to meet each customer’s needs. Using this data, OEE is automatically calculated and displayed in real-time. Companies can choose to deploy overhead displays in the shop or direct feedback to the operators. All data supporting the OEE calculations are stored and can be viewed and analyzed at any time and on any level. Users can view OEE by company, facility, work center, machine, or part.
Using Mingo, you can go beyond Overall Equipment Effectiveness, and beyond Availability, Performance, & Quality, to second by second details of what was happening when a line went down, was running slow, or produced a bad part.
Mingo can show you speeds, feeds, pressure, temperature, and any other metrics gathered from a sensor on that same line. This data is shown in the context of the production records and can be used to solve and fix issues right at the source of the problem.
By implementing Mingo, you can set yourself up to take advantage of the smart factory without a huge upfront financial or time commitment.
Mingo is more affordable and easy to use. Our technology delivers the power of information in simple dashboards that are easy to set up. These dashboards put the power of saving money in the hands of every manufacturer.
Use our simple OEE Calculator to quickly calculate OEE, availability, performance, and quality
OEE is a vital metric to most manufacturers, but it is even more beneficial when you view it as a financial KPI.
Did you know the same OEE number can mean very different things? OEE does not provide the “Why?”.
World-class OEE of 85% is a myth. Let’s take a deep dive into world-class OEE and why it’s not best practice.
Built by people who know manufacturing, Mingo Smart Factory provides the 21st century “Smart Factory” experience that manufacturers need to grow in a modern environment. See how it can help you drive revenue.
© Copyright 2024 Mingo Smart Factory » Privacy